Google Ads Reports on Google Analytics
Google Ads and Google Analytics go hand in hand, one complimenting the other very well. You need Google Analytics data to understand whom to advertise to, what time of the day to run your ads and what keywords to gun for.
This article talks about how to interpret you Google Ads campaign data better through Google Analytics.
Linking Google Analytics to Google Ads
In order to start seeing your ad data on Google Analytics, you have to first link the 2 accounts. Go to Admin, Property, and click on Google Ads Linking. Click on New Link Group. You will see a list of Google Ads accounts that you have Edit permission for. Select the account that you want to link.
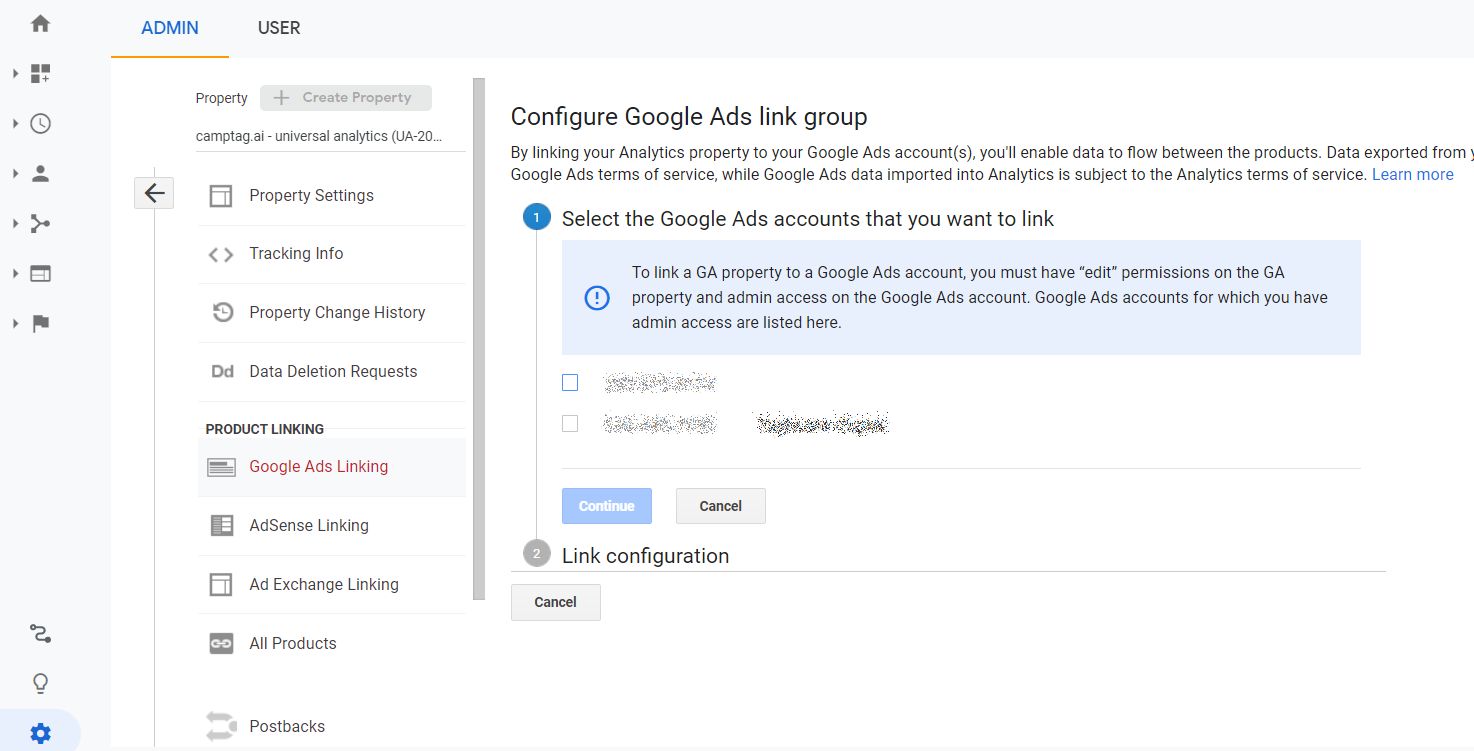
This step will ensure that you can see more details of your Google Ads performance in Google Analytics.
And this stage, go ahead and create you Ad campaigns. If you need help, you can refer to our Step-by-step guide to setting up Google Ads campaigns.
What Google Ads data can you see on Google Analytics?
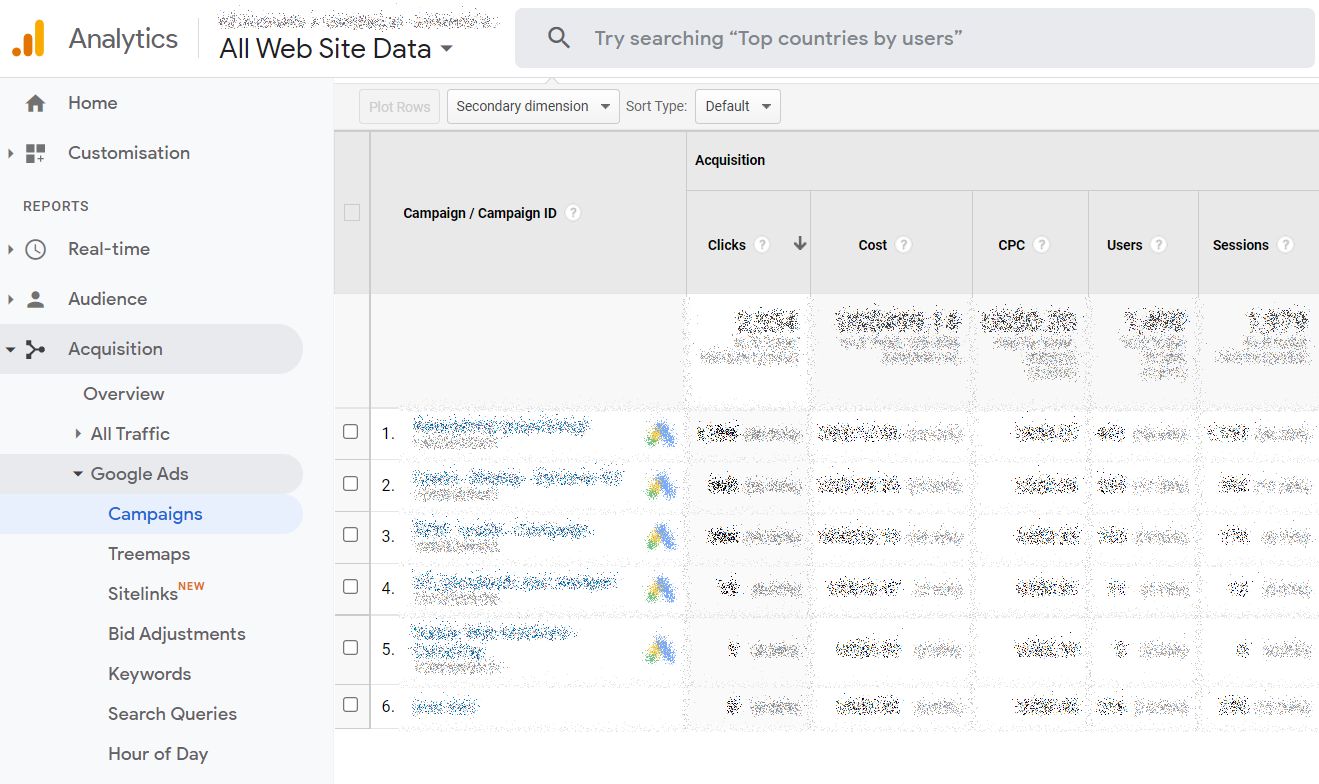
All Google Ads can be viewed in GA standard reports – Acquisition -> Google Ads.
- 1. Basic Campaign data
-
This includes Clicks, Cost, CPC, Users, Sessions, Bounce rate, Pages/session and also the Goal data that has already been set up. You might notice that there are couple of fields missing in Google Analytics that are present in the Google Ads interface – Impressions, Clickthrough rate or CTR.
- 2. Treemaps
-
Treemap shows the share of sessions or users at campaign level, ad group level or keyword level. The default is campaign level from which you can drill down into ad groups and keywords, by clicking on the boxes (though it did not work for me) or the relevant links in the table below.
Primary metrices like sessions and cost are denoted by the size of the boxes, and secondary metrices or calculated metrices like cost per click or bounce rate are denoted by the color of the box. Green for good, and red for bad, with shades of dark green denoting highly positive, and shades of dark red denoting highly negative.
The report only shows 16 boxes at a time. If there are more than 16 entities to the value you have chosen, only the top 15 will be shown as boxes. All the remaining entity values will be combined in the final box.
- 3. Sitelinks Report (new)
-
Sitelinks are added to Google Ads to help users explore deeper into your website with specific pages like Pricing, Free trial, Sign up or Contact form. These sitelinks can be created at account, campaign or ad group levels.
Sitelinks Report in GA shows the Users, Sessions, Clicks, Cost, CPC, Bounce rate, Pages/session and Conversion values.
If you have not already set up sitelink extensions, it is a good idea to set them up in Google Ads under Ads and Extensions.
- 4. Bid Adjustments
-
Bid adjustments are percentage increases or decreases you can make to your campaign bids based on devices used by customers, geography, time of the day etc. These variations can made within your daily budget by just changing the proportion of budget allocation.
Bid Adjustments Report in GA gives you very insightful information on:
- Devices used by customers who clicked on your ads
- Device information at Ad Group level
- Location
- Ad schedule or time slots you have chosen for your ads to run
- There are also secondary dimensions that you can add to this report for more segmented data
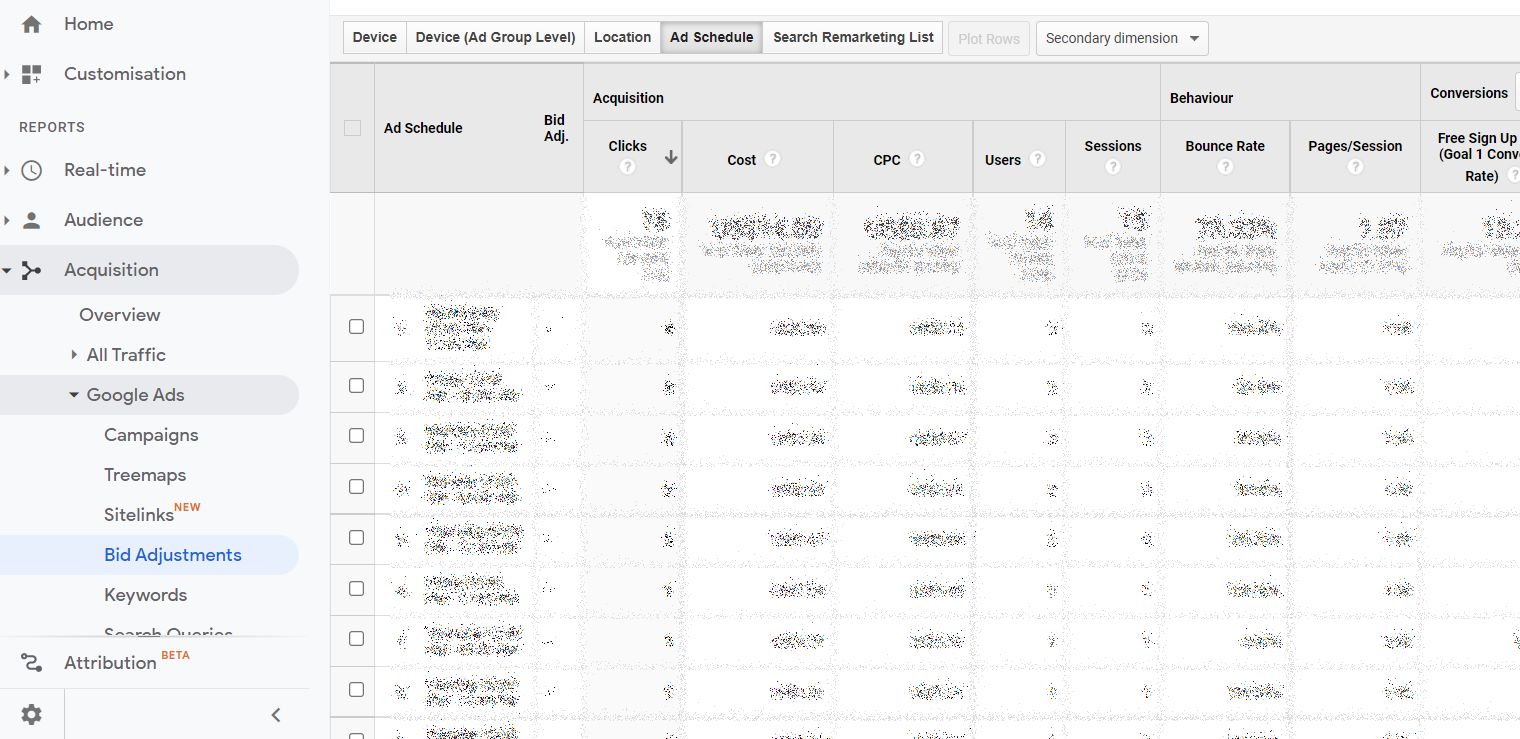
Based on this information, you can make bid adjustments in Google Ads.
Making Bid Adjustments in Google Ads
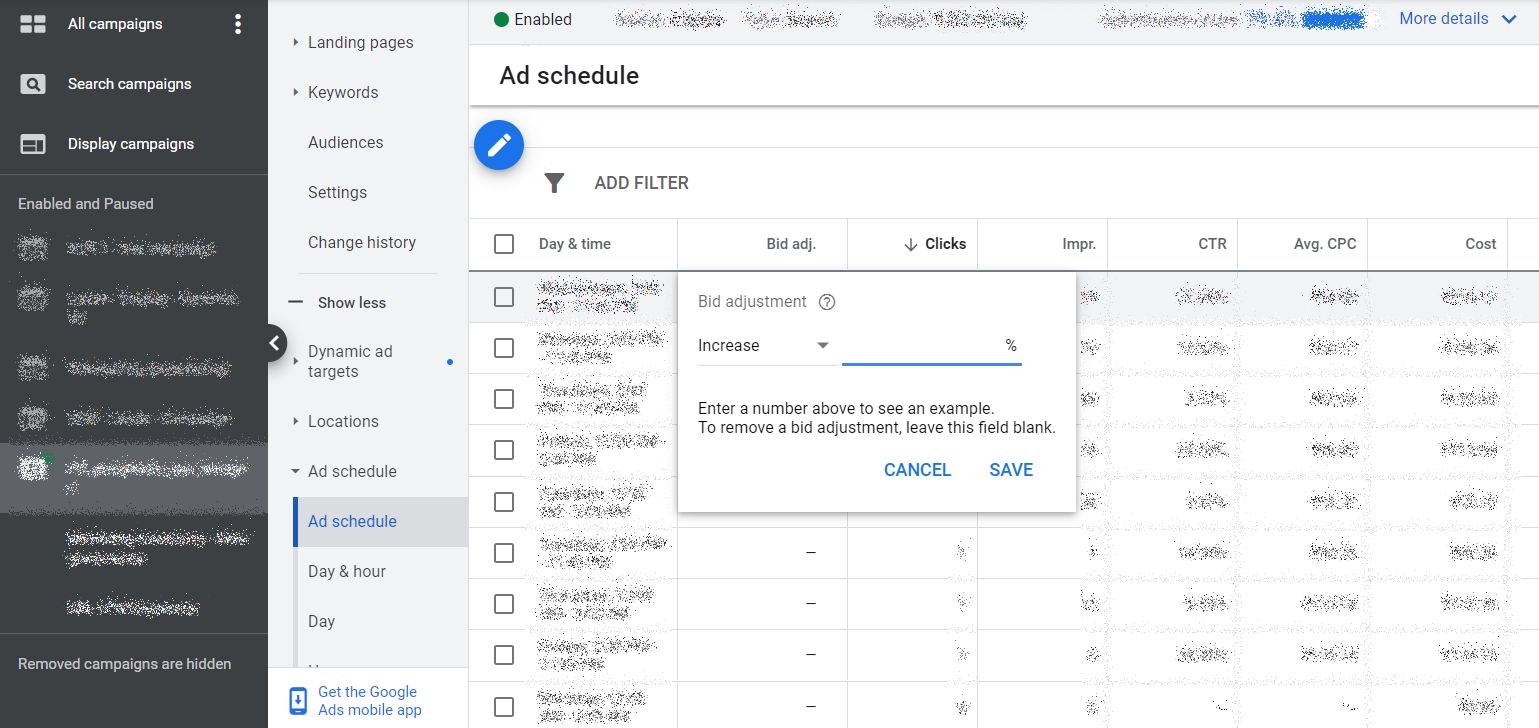
In the left nav menu, scroll all the way down and click on More. You can see segmented data based on Locations, Ad schedule, Day and Hour, Day, Hour and Devices.
Click on the segment that you want to make bid adjustments for.
In the table, click on the column that says Bid adj. You can decrease bids up to 100% and increase bids up to 900%, based on what segment is working or not working. Remember that decreasing a bid by 100% will remove that segment from your ads.
For example, if you do not want to show your ads to users from mobile devices, you can reduce the bid by 100% to achieve this.
Remember that bid adjustments must be done after studying the behavior of a good number of users so that you can predict the trends accurately, before adjusting bids.
- 5. Keywords report
-
Keywords report gives you an understanding of which keywords are performing well, with parameters like Clicks, Cost, CPC, Users, Session, Bounce rate, Pages/session, and Conversion values.
If a particular keyword has high traffic, but high bounce, you could consider removing that keyword from Google Ads since that’s not your target keyword. Similarly, if a keyword is having low traffic, but high conversion, you could try increasing the bid for that keyword to make sure you get more targeted audience.
Primary dimension of Ad Content is also available to understand which ad content is performing well.
- 6. Search Queries Report
-
This report gives you a clear picture of what exactly your target audience is searching for, including long tail keywords. Choose the secondary dimension as Keyword so that you understand which keyword is mapped to each search query.
Sometimes, this report is useful in adding negative keywords so that you don’t get unwanted traffic to your campaign.
Search Queries Report can also help you decide whether the Keyword matching you have used is working. If you have used Exact match, and it’s not giving you the results you want, you might want to consider switching to Phrase match or Broad match to get you more traffic.
Choose secondary dimension as Query word count to understand whether single word, short or long-tail queries are working best for you.
- 7. Hour of Day
-
Hour of day report is very simple and straight-forward - it helps you understand what time period your ads are performing best. From 00 to 23, this hourly performance report is very essential to decide whether you are running your campaigns at a time when you customers are most active.
You can tweak the campaign schedule based on this data, removing time slots where you are not getting targeted traffic. Or make bid adjustments to increasing spending during the time that you get targeted traffic.
Sort by Goal conversions or Goal values to see the time slots that work best for you.
- 8. Final URLs report
-
This report gives you a summary of all the URLs you have used including UTM tagging, and their performance, so that you know whether a text ad is performing better than a banner ad. You can change the Primary dimension to Ad Distribution Network to see which channel is working best.
Choose secondary dimensions of Source, Medium, Campaign etc. to see more segmented data, provided you have tagged your URLs with the right UTM parameters.
- 9. Display Targeting Report
-
Display targeting report is applicable only for ads that are focused on GDN or Google Display Network, a set of sites owned by Google or their partners. This applies for Display Network Only, and also for Search Network with Select Display. There are a bunch of Primary dimensions available to understand the performance of your display ads better.
Display keywords – to know which keywords or ad groups are more effective.
Managed placements – to understand which website or app is working.
Topics – to see which topics are working better.
Interests and Remarketing – to understand which remarketing list of working best.
Age and Gender – to know which age and gender clicks most on the ads.
You can use Compare all, Filter by campaign, Filter by parameter value, or even add Secondary dimensions like device type to understand more about your display ad performance.
- 10. Video campaigns
-
Video campaigns report is applicable only for video campaigns that are auto-tagged using Trueview video ads. Manually tagged video ad data will not be available under this report.
You can analyze Users, Sessions, Paid view, Cost, CPV, Bounce rate, Pages/session and Conversion values.
- 11. Shopping campaigns
-
Specific to e-commerce shopping campaigns only. In addition to Primary dimensions of Users, Sessions etc., you can add Secondary dimensions like Shopping Category, Shopping Product Type, Shopping Brand, to understand your campaigns better.
Disparity of data between Google Ads and Google Analytics
Many a times, you may find mismatches between Google Ads and Google Analytics data for a variety of reasons.
- Google Ads will only show invalid clicks like multiple clicks on an ad, but Google Analytics will show all clicks.
- Google Ads shows Clicks, whereas Google Analytics shows Sessions data.
- If your campaign is not auto tagged, or manual tagged with UTM parameters, Google Analytics might have difficulty in attributing them to paid campaigns.
If you need help with tagging your URL for marketing campaigns correctly, reach out to Camptag, the awesome marketing taxonomy and URL builder tool.